Write a program in (mathrm{R}) that generates (b) samples of size (n) from a density that is
Question:
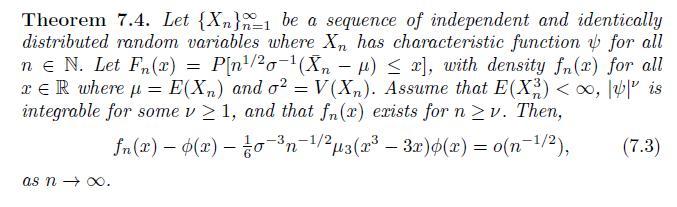
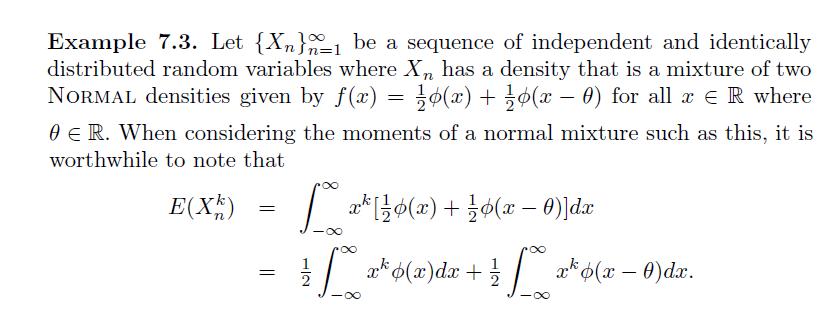
Write a program in \(\mathrm{R}\) that generates \(b\) samples of size \(n\) from a density that is a mixture of two NORmaL densities given by \(f(x)=\frac{1}{2} \phi(x)+\frac{1}{2} \phi(x-\theta)\) for all \(x \in \mathbb{R}\) where \(\theta \in \mathbb{R}\). In Example 7.3 we found that \(E\left(X_{n}ight)=\frac{1}{2} \theta, E\left(X_{n}^{2}ight)=\) \(1+\frac{1}{2} \theta^{2}, E\left(X_{n}^{3}ight)=\frac{1}{2} \theta^{3}+\frac{3}{2} \theta\), and \(E\left(X_{n}^{4}ight)=-\frac{1}{2} \theta^{4}+\frac{3}{2} \theta^{2}+3\). The third and fourth moments of the normal mixture are \(\mu_{3}=0\) and \(\mu_{4}=-\frac{3}{16} \theta^{4}+\frac{3}{2} \theta^{2}+3\). The third cumulant is also zero, and the fourth cumulant is \(\kappa_{4}=-\frac{15}{16} \theta^{4}-\) \(\frac{3}{2} \theta^{2}\). For each sample compute the statistic \(Z_{n}=n^{1 / 2} \sigma^{-1}\left(\bar{X}_{n}-\muight)\) where \(\mu\) and \(\sigma\) correspond to the mean and standard deviation specified above. Produce a plot of the empirical distribution function of the \(b\) values of \(Z_{n}\). On each plot overlay a plot of the standard normal distribution function and the function given by the one-term Edgeworth expansion. Discuss how these functions compare to what would be expected for large \(n\) as regulated by the underlying theory given by Theorems 4.20 and 7.4. Run this simulation for \(n=10,25,50\), and 100 each with \(\theta=0,0.50,1.00\), and 3.00 .
Step by Step Answer:

This question has not been answered yet.
You can Ask your question!