

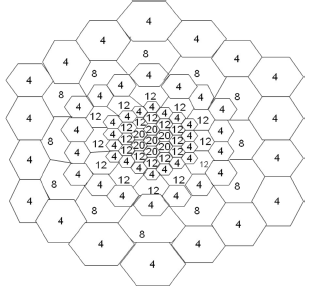
The figure shows the cell structure of a metro area. Can you explain why this might have
Question:
Fantastic news! We've Found the answer you've been seeking!
Step by Step Answer:
The smaller cells and the greater number of channels assigned to the ce...View the full answer

Answered By
Nyron Beeput
I am an active educator and professional tutor with substantial experience in Biology and General Science. The past two years I have been tutoring online intensively with high school and college students. I have been teaching for four years and this experience has helped me to hone skills such as patience, dedication and flexibility. I work at the pace of my students and ensure that they understand.
My method of using real life examples that my students can relate to has helped them grasp concepts more readily. I also help students learn how to apply their knowledge and they appreciate that very much.
1+ Reviews
10+ Question Solved
Related Book For 
Introduction to Wireless and Mobile Systems
ISBN: ?978-1305087132
4th edition
Authors: Dharma P. Agrawal, Qing An Zeng
Question Posted:
