A TP diagram of carbon is presented in the following fi gure. The following data are available
Question:
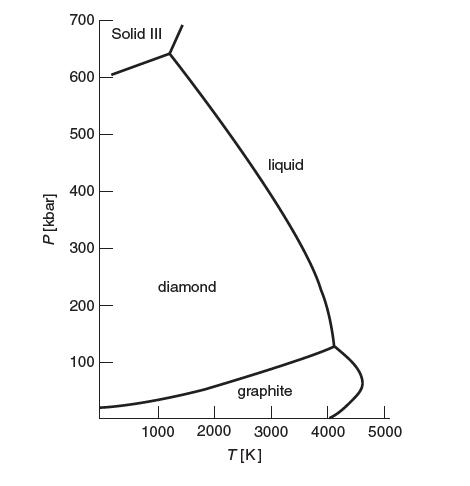
A TP diagram of carbon is presented in the following fi gure. The following data are available at 25°C.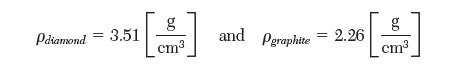
Answer the following questions:
(a) Identify the region where diamond is the thermodynamically stable phase of carbon. In this region, what can you say about the Gibbs energy of diamond relative to the other phases of carbon?
(b) What is the lowest temperature that liquid carbon can exist? What is the pressure at that temperature?
Identify the location on the TP diagram.
(c) Using the preceding phase diagram, estimate the difference in enthalpy between diamond (d) and graphite (g), Δh = hd - hg at 300K. You may assume Δh is constant.
(d) From the value of Δh in Part (c), which phase has stronger bonds? Explain. Does this make physical sense?
(e) Obtain a more accurate estimate of Δh at 300K using the values of specifi c heat for diamond and graphite: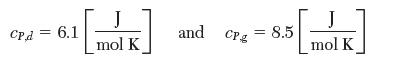
Step by Step Answer: