

Sets of data for two different binary mixtures are plotted in the following figure. On the top
Question:
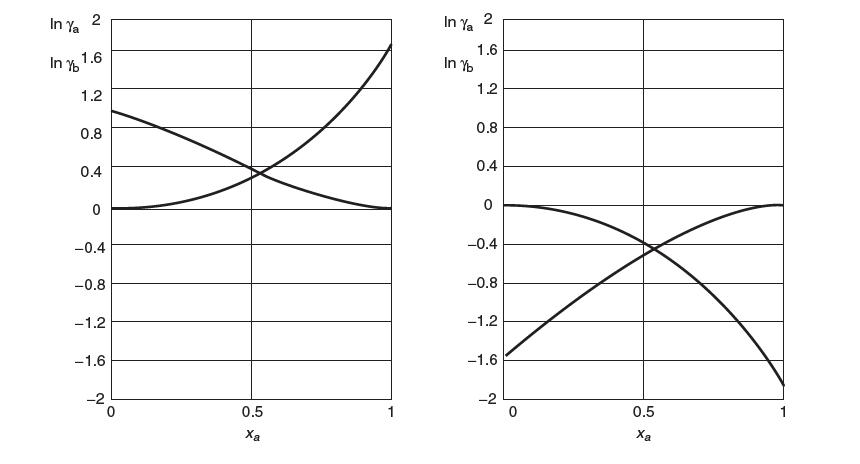
Sets of data for two different binary mixtures are plotted in the following figure. On the top are two plots of the liquid phase fugacity coefficient of species a versus mole fraction of a, and on the bottom are plots of activity coefficient of a and b versus mole fraction of a. Take Lewis/Randall reference states for a and b. Each of the plots above (I and II) corresponds to a specific plot in the figure.
(a) Match the appropriate plot on top with the one on the bottom. Explain.
(b) On both of the bottom plots, identify which lines corresponds to ln ga. Explain.
(c) Draw in the lines for ln γaHenry's and ln γbHenry's on the bottom plots. Explain your method.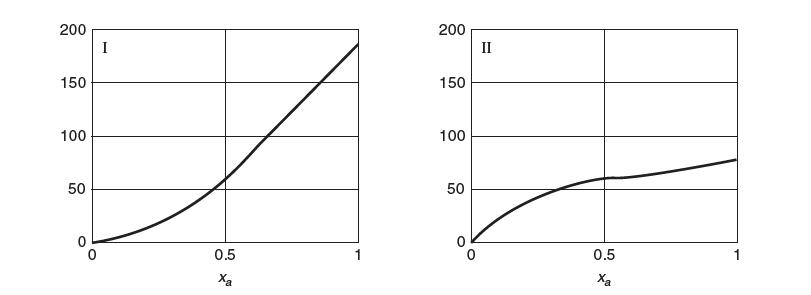
Step by Step Answer:

This question has not been answered yet.
You can Ask your question!
Related Book For 

Question Posted:
