

Use the data in the steam tables to plot the vaporliquid dome on a Pv diagram. It
Question:
Use the data in the steam tables to plot the vapor–liquid dome on a Pv diagram. It is useful to plot v on a log scale.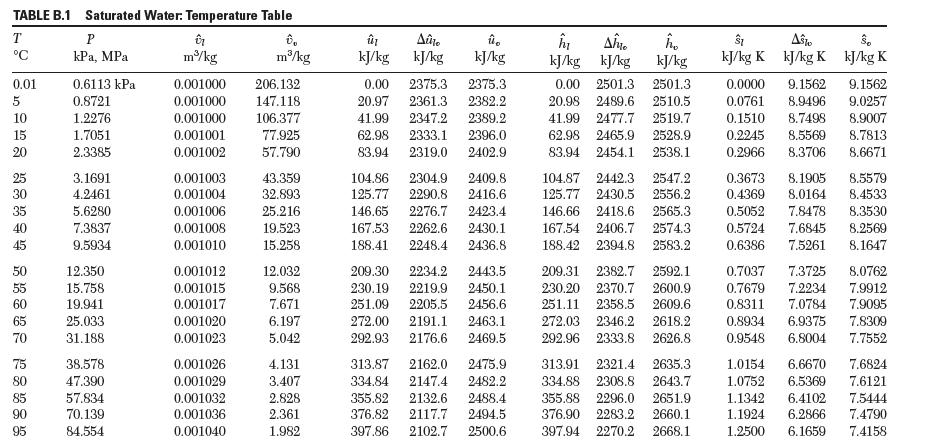
Transcribed Image Text:
TABLE B.1 Saturated Water: Temperature Table T , C m/kg 0.01 5 10 15 20 25 30 35 40 45 50 55 60 65 70 75 80 85 90 95 P kPa, MPa 0.6113 kPa 0.8721 1.2276 1.7051 2.3385 3.1691 4.2461 5.6280 7.3837 9.5934 12.350 15.758 19.941 25.033 31.188 38.578 47.390 57.834 70.139 84.554 m/kg 0.001000 206.132 0.001000 147.118 0.001000 106.377 0.001001 77.925 0.001002 57.790 0.001003 0.001004 0.001006 0.001008 0.001010 0.001012 0.001015 0.001017 0.001020 0.001023 0.001026 0.001029 0.001032 0.001036 0.001040 43.359 32.893 25.216 19.523 15.258 12.032 9.568 7.671 6.197 5.042 4.131 3.407 2.828 2.361 1.982 kJ/kg Ate . kJ/kg kJ/kg 0.00 2375.3 2375.3 20.97 2361.3 2382.2 41.99 2347.2 2389.2 62.98 2333.1 2396.0 83.94 2319.0 2402.9 104.86 2304.9 2409.8 125.77 2290.8 2416.6 146.65 2276.7 2423.4 167.53 2262.6 2430.1 188.41 2248.4 2436.8 209.30 2234.2 2443.5 230.19 2219.9 2450.1 251.09 2205.5 2456.6 272.00 2191.1 2463.1 292.93 2176.6 2469.5 313.87 2162.0 2475.9 334.84 2147.4 2482.2 355.82 2132.6 2488.4 376.82 2117.7 2494.5 397.86 2102.7 2500.6 Ae kJ/kg kJ/kg kJ/kg 0.00 2501.3 2501.3 20.98 2489.6 2510.5 41.99 2477.7 2519.7 62.98 2465.9 2528.9 83.94 2454.1 2538.1 104.87 2442.3 2547.2 125.77 2430.5 2556.2 146.66 2418.6 2565.3 167.54 2406.7 2574.3 188.42 2394.8 2583.2 209.31 2382.7 2592.1 230.20 2370.7 2600.9 251.11 2358.5 2609.6 272.03 2346.2 2618.2 292.96 2333.8 2626.8 313.91 2321.4 2635.3 334.88 2308.8 2643.7 355.88 2296.0 2651.9 376.90 2283.2 2660.1 397.94 2270.2 2668.1 1 kJ/kg K Asto kJ/kg K 0.0000 9.1562 0.0761 8.9496 0.1510 8.7498 0.2245 8.5569 0.2966 8.3706 0.7037 7.3725 0.7679 7.2234 0.8311 7.0784 0.8934 6.9375 0.9548 6.8004 o kJ/kg K 0.3673 8.1905 8.5579 0.4369 8.0164 8.4533 0.5052 7.8478 8.3530 0.5724 7.6845 8.2569 0.6386 7.5261 8.1647 1.0154 6.6670 1.0752 6.5369 1.1342 6.4102 1.1924 6.2866 1.2500 6.1659 9.1562 9.0257 8.9007 8.7813 8.6671 8.0762 7.9912 7.9095 7.8309 7.7552 7.6824 7.6121 7.5444 7.4790 7.4158
Step by Step Answer:

This question has not been answered yet.
You can Ask your question!
Related Book For 
Question Posted:
Students also viewed these Engineering questions
-
Use EES or NIST to plot the following states as a cycle on a Pv diagram and a Ts diagram. Include the vapor dome on each plot. 1. Saturated liquid water at 3 MPa. 2. Saturated vapor water at 3 MPa....
-
Use EES or NIST to plot the following states as a cycle on a Pv diagram and a Ts diagram. Include the vapor dome on each plot. 1. Saturated liquid water at 3 MPa. 2. Saturated vapor water at 3 MPa....
-
Assume that the marginal product of capital is given by the following expression: MPK = 60/K^0.7 (K is measured in trillions). a) Graph the demand curve for capital and find the equilibrium real...
-
ABC operates a meat and poultry business. The corporation distributes its products in six states and pays income tax to each based on the meat and poultry income apportionable to each. Last year, ABC...
-
Prepare the journal entry to reconcile the bank statement in EA11. Data from in EA11 Using the following information, prepare a bank reconciliation. Bank balance: $6,988 Book balance: $6,626 ...
-
Verify that the Tweedie distribution is a member of the linear exponential family of distributions by checking equation (13.9). In particular, provide an expression for \(S(y, \phi)\) (note that...
-
Downward demand spiral Spirelli Company is about to enter the highly competitive personal electronics market with a new optical reader. In anticipation of future growth, the company has leased a...
-
a) Figure la shows an overall two-port network consisting of Network A and Network B in a certain interconnection. Network A and Network B are respectively a T-network and a -network as shown....
-
Calculate the volume of water using the ideal gas model under the following conditions. Then report the percent error when compared to the values reported in the steam tables. (a) P = 1.01 [bar]; T =...
-
A rigid container of volume 1 m3 contains saturated water at 1 MPa. If the quality is 0.10, what is the volume occupied by the vapor?
-
Use indefinite integrals to solve the following differential equations. Sketch a graph of the rate of change and the solution on the given domain. dp/dt = 5t3 + 5/t2 with p(1) = 12.0. Sketch the rate...
-
After implementing the talent management model in an organization to make the hiring process more effective, what is the Post Implementation Support: (e.g. Field Support) - (What processes, tools,...
-
analyze the decision making issue for a company pursuing a new vision as a context and address the following elements: Describe the issue as it relates to that company. Use specifics to provide the...
-
Part 2 Project network/schedule -scheduling and compressing a schedule (30 points) You've been asked to manage a project that includes conducting a two-week (10 working days) computer training class....
-
Does LVMH pay much attention to cross-cultural differences in its international assignments? What should it do to better prepare its expatriates for adjustment in the host country they are sent to?
-
Which type of determinism as discussed in the screencast is most responsible for determining what happens to us in our lives? Provide at least two specific examples of this type of determinism and...
-
Some overhead data for Derby Company are given in BE22-6. In addition, the flexible manufacturing overhead budget shows that budgeted costs are $4 variable per direct labor hour and $50,000 fixed....
-
The text defined intrinsic value as the value of an asset given a hypothetically complete understanding of the assets investment characteristics. Discuss why hypothetically is included in the...
-
Show by writing appropriate chemical equations how each of the following compounds could be converted to 3-hexyne: (a) 1-Butene (b) 1, 1-Dichlorobutane (c) Acetylene
-
When 1, 2-dibromodecane was treated with potassium hydroxide in aqueous ethanol, it yielded a mixture of three isomeric compounds of molecular formula C10H19Br. Each of these compounds was converted...
-
Write the structure of the major organic product isolated from the reaction of 1-hexyne with (a) Hydrogen (2 mol), platinum (b) Hydrogen (1 mol), Lindlar palladium (c) Lithium in liquid ammonia (d)...
-
Which layer is responsible for moving a frame from one hop to another? a . Physical b . Data Link c . Network d . Transport . None of the choicesNext page Type here to searchFi
-
M3b Develop Tools to Make Use of Oracle's Data Dictionary BAssignment Assignment Develop basic tools to expedite use of Oracle's data dictionary Tasks C 1. Write a script that provides all of the...
-
XYZ Corporation, a multinational company, is planning to expand its operations to a new country. However, before making a final decision, the company needs to consider the flow of funds and its...

Study smarter with the SolutionInn App