

In the pie-chart graphs, the percent natural abundance for Cl-35 (atomic mass 34.969 amu) is represented as
Question:
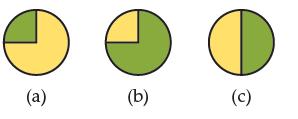
In the pie-chart graphs, the percent natural abundance for Cl-35 (atomic mass 34.969 amu) is represented as green, and the percent natural abundance for Cl-37 (atomic mass 36.966 amu) is represented as yellow. Given that the atomic mass listed for Cl in the periodic table 35.353 amu, and without looking up the percent natural abundances for either isotope, which pie chart is most correct? Explain your reasoning.
Fantastic news! We've Found the answer you've been seeking!
Step by Step Answer:
The second pie chart is the most correct Explanation The atomic mass of an element is the average ma...View the full answer

Answered By
Joram mutua
I am that writer who gives his best for my student/client. Anything i do, i give my best. I have tutored for the last five years and non of my student has ever failed, they all come back thanking me for the best grades. I have a degree in economics, but i have written academic papers for various disciplines due to top-notch research Skills.In additional, I am a professional copywriter and proofreader.
2+ Reviews
10+ Question Solved
Related Book For 
Introductory Chemistry Atoms First
ISBN: 9780321927118
5th Edition
Authors: Steve Russo And Michael Silver
Question Posted:
