

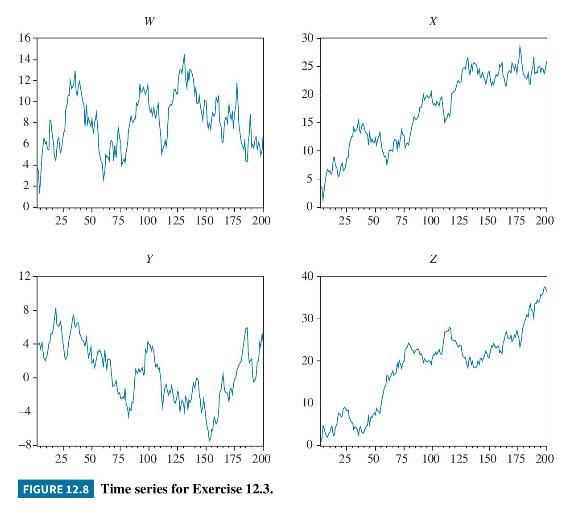
Figure 12.8 shows plots of four time series that are stored in the data file unit. a.
Question:
Figure 12.8 shows plots of four time series that are stored in the data file unit.
a. The results from Dickey-Fuller test equations for these four variables are given below. Explain why these equations were chosen. No augmentation terms are included. What criteria would have led to their omission?
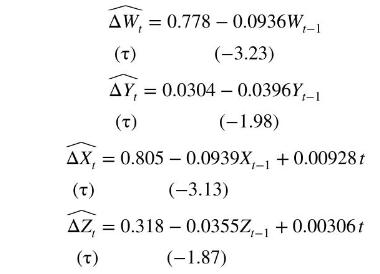
b. Carry out Dickey-Fuller tests on each of the series. What do you conclude about their stationarity properties?
c. The following estimated equation uses residuals \(\hat{e}_{t}\) from least-squares estimation of the model \(X_{t}=\beta_{1}+\delta t+\beta_{2} Z_{t}+e_{t}\). Can you conclude that \(X_{t}\) and \(Z_{t}\) are cointegrated?
\[
\begin{aligned}
& \widehat{\Delta \hat{e}_{t}}=-0.0683 \hat{e}_{t-1} \\
& (\tau) \quad(-2.83)
\end{aligned}
\]
d. Use the following equation and earlier results to assess the order of integration of \(Z_{t}\).
\[ \widehat{\Delta\left(\Delta Z_{t}\right)}=0.174-0.987 \Delta Z_{t-1} \] \((\tau) \quad(-13.76)\)
Data From Figure 12.8:-
Step by Step Answer:


Principles Of Econometrics
ISBN: 9781118452271
5th Edition
Authors: R Carter Hill, William E Griffiths, Guay C Lim
