

We have data on 2323 randomly selected households consisting of three persons in 2013. Let ENTERT denote
Question:
We have data on 2323 randomly selected households consisting of three persons in 2013. Let ENTERT denote the monthly entertainment expenditure (\$) per person per month and let INCOME \($100\) be monthly household income. Consider the regression model
![]()
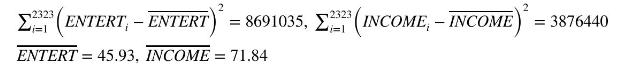
Assume that assumptions SR1-SR6 hold. The OLS estimated equation is \(\widehat{E N T E R T}_{i}=9.820+\) \(0.503 I N C O M E_{i}\). The standard error of the slope coefficient estimator is \(\operatorname{se}\left(b_{2}\right)=0.029\), the standard error of the intercept estimator is \(\operatorname{se}\left(b_{1}\right)=2.419\), and the estimated covariance between the least squares estimators \(b_{1}\) and \(b_{2}\) is -0.062 . From the summary statistics, we find
a. From the estimated regression, the sum of squared least squares residuals is 7711432. How well does the regression model fit the data? How much of the household variation in entertainment expenses have we explained using this regression model? Explain your answer.
b. The Jones household has income of \(\$ 10,000\) per month. Predict their per person household expenditure on entertainment.
c. Calculate a 95\% prediction interval for the Jones household's per person expenditure on entertainment. Show your work.
d. Calculate a \(95 \%\) prediction interval for the Jones household's total household expenditure on entertainment. Show your work.
Step by Step Answer:


Principles Of Econometrics
ISBN: 9781118452271
5th Edition
Authors: R Carter Hill, William E Griffiths, Guay C Lim
