

The following table gives the 2015 total payroll (in millions of dollars) and the percentage of games
Question:
The following table gives the 2015 total payroll (in millions of dollars) and the percentage of games won during the 2015 season by each of the American League baseball teams.
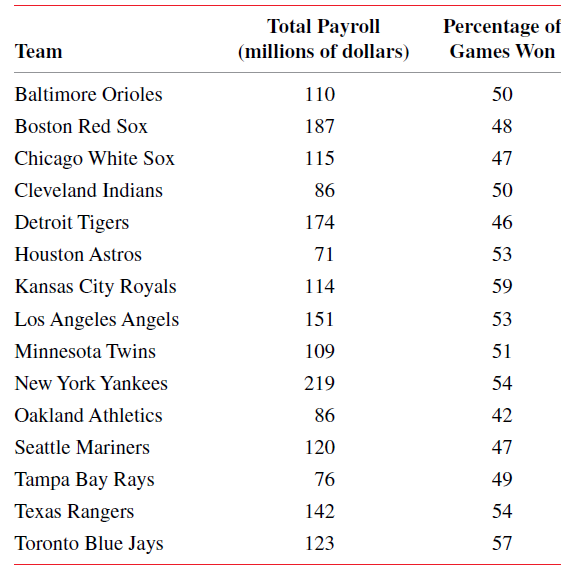
Compute the linear correlation coefficient, ρ. Does it make sense to make a confidence interval and to test a hypothesis about ρ here? Explain.
Fantastic news! We've Found the answer you've been seeking!
Step by Step Answer:
Let x total payroll in millions of dollars and y runs sc...View the full answer

Answered By
Ashish Jaiswal
I have completed B.Sc in mathematics and Master in Computer Science.
20+ Reviews
39+ Question Solved
Related Book For 

Question Posted:
