

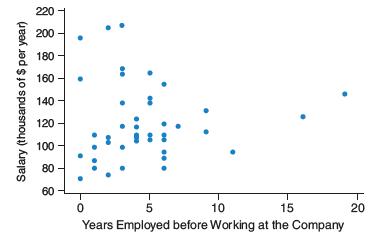
The first graph shows the years a person was employed before working at the company and the
Question:
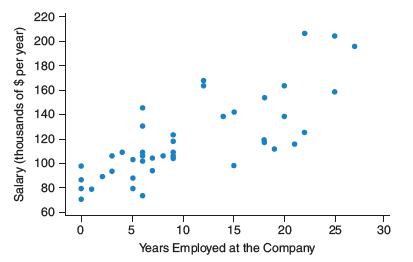
The first graph shows the years a person was employed before working at the company and the salary at the company. The second graph shows the years employed at the company and the salary. Which graph shows a stronger relationship and could do a better job predicting salary at the company?
Step by Step Answer:

This question has not been answered yet.
You can Ask your question!
Related Book For 

Introductory Statistics Exploring The World Through Data
ISBN: 9780135163146
3rd Edition
Authors: Robert Gould, Rebecca Wong, Colleen N. Ryan
Question Posted:
