

The following boxplot shows the percentage of the population that has earned a bachelors (BA) degree in
Question:
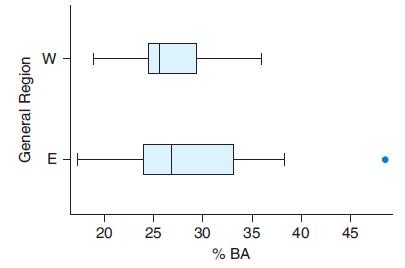
The following boxplot shows the percentage of the population that has earned a bachelor’s (BA) degree in the western (W) and eastern (E) United States. Estimate and interpret the median for each group.
a. In which region does a greater percentage of the population have a BA degree?
b. Which region has more variation in BA attainment?
Fantastic news! We've Found the answer you've been seeking!
Step by Step Answer:
a The median for the Western region W is around 35 while the ...View the full answer

Answered By
Churchil Mino
I have been a tutor for 2 years and have experience working with students of all ages and abilities. I am comfortable working with students one-on-one or in small groups, and am able to adapt my teaching style to meet the needs of each individual. I am patient and supportive, and my goal is to help my students succeed.
I have a strong background in math and science, and have tutored students in these subjects at all levels, from elementary school to college. I have also helped students prepare for standardized tests such as the SAT and ACT. In addition to academic tutoring, I have also worked as a swim coach and a camp counselor, and have experience working with children with special needs.
0 Reviews
10+ Question Solved
Related Book For 

Introductory Statistics Exploring The World Through Data
ISBN: 9780135163146
3rd Edition
Authors: Robert Gould, Rebecca Wong, Colleen N. Ryan
Question Posted:
