

The histogram shown is for number of calories in a sample of fast-food items. a. What is
Question:
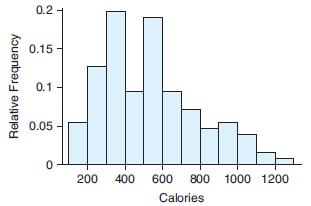
The histogram shown is for number of calories in a sample of fast-food items.
a. What is the bin width of the histogram?
b. Would this graph be best described as unimodal or bimodal?
c. Approximately what percentage of the fast-food items contained fewer than 300 calories?
Fantastic news! We've Found the answer you've been seeking!
Step by Step Answer:
a The bin width of the histogram Width200100 100 The bin width of the histogr...View the full answer

Answered By
JULIE ANN CAINDOC
Margret Kilonzo is a freelance SEO content and academic writer with three years of experience making content for different websites and writing academic research papers, helping her thousands of students to fulfill their educational needs. She approaches the writing process with self-motivation and enthusiasm to polish each piece using reliable information and proper grammar. Her strengths include; the capability to produce documents devoid of grammatical errors and sound knowledge of common referencing styles like APA and MLA
0 Reviews
10+ Question Solved
Related Book For 

Introductory Statistics Exploring The World Through Data
ISBN: 9780135163146
3rd Edition
Authors: Robert Gould, Rebecca Wong, Colleen N. Ryan
Question Posted:
