

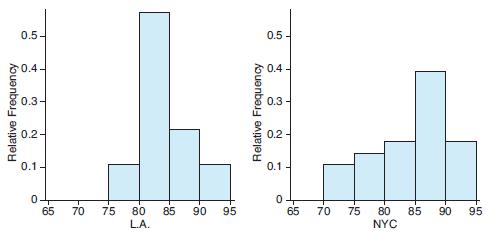
The histograms below were created from data on the daily high temperature in Los Angeles and New
Question:
The histograms below were created from data on the daily high temperature in Los Angeles and New York City during a summer month. Compare the two distributions. Which city do you think has the higher typical temperature? Which city has more variation in temperature? Explain. (Source: Accuweather.com)
Fantastic news! We've Found the answer you've been seeking!
Step by Step Answer:
From the given 2 distributions here we see that there are higher frequencies for values that ar...View the full answer

Answered By
MORINKE KUDAOS
I am an educator that has the necessary abilities and expertise owing to extensive interaction with students. I present answers to a variety of problems with step-by-step explanations, a well-thought-out strategy, and an easily understood breakdown. My objective is to teach students more easy methods and comprehension so that they may attain more success.
0 Reviews
10+ Question Solved
Related Book For 

Introductory Statistics Exploring The World Through Data
ISBN: 9780135163146
3rd Edition
Authors: Robert Gould, Rebecca Wong, Colleen N. Ryan
Question Posted:
