Find the solution to the fishing problem of Example 5.4 when the interest rate is ($33)% Are
Question:
Find the solution to the fishing problem of Example 5.4 when the interest rate is \($33\)% Are the decisions different than when the interest rate is \($25\) %? At what critical value of the discount factor does the solution change?
Data from Example 5.4
Suppose that you own both a lake and a fishing boat as an investment package. You plan to profit by taking fish from the lake. Each season you decide either to fish or not to fish. If you do not fish, the fish population in the lake will flourish, and in fact it will double by the start of the next season. If you do fish, you will extract 70% of the fish that were in the lake at the beginning of the season. The fish that were not caught (and some before they are caught) will reproduce, and the fish population at the beginning of the next season will be the same as at the beginning of the current season. So corresponding to whether you abstain or fish, the fish population will either double or remain the same, and you get either nothing or 70% of the beginning-season fish population. The initial fish population is 10 tons. Your profit is \($1\) per ton. The interest rate is constant at 25%, which means that the discount factor is .8 each year. Unfortunately you have only three seasons to fish. The management problem is that of determining in which of those seasons you should fish.
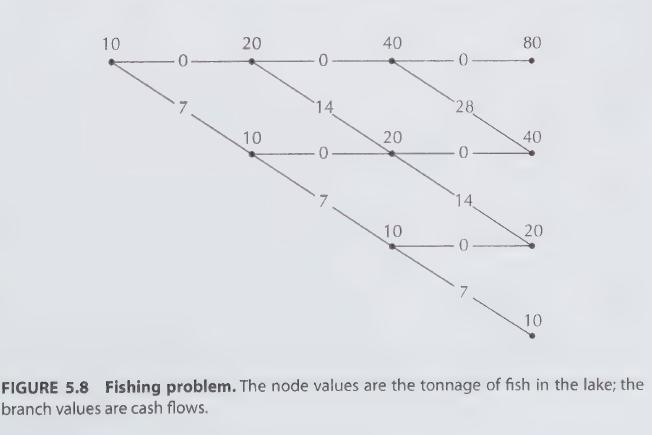
The situation can be described by the binomial lattice shown in Figure 5.8. The nodes are marked with the fish population. A lattice, rather than a tree, is appropriate because only the fish population in the lake is relevant at any time. The manner by which that population was achieved has no effect on future cash flows. The value on a branch indicates the catch (and hence the cash flow) associated with that branch. Horizontal branches correspond to no fishing and no catch, whereas downward directed branches correspond to fishing.
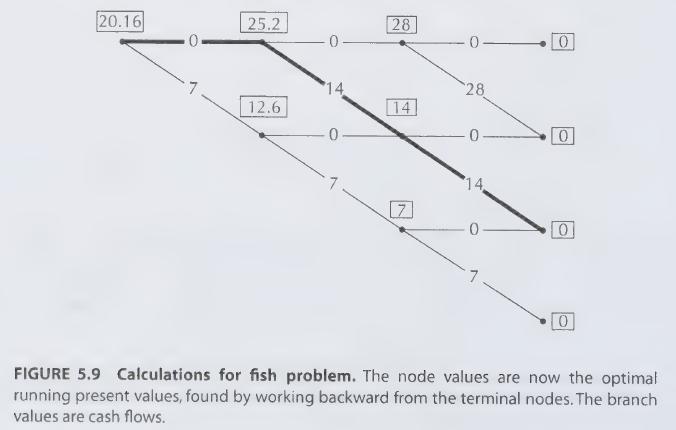
The problem is solved by working backward. We assign the value of 0 to each of the final nodes, since once we are there we can no longer fish. Then at each of the nodes one step from the end we determine the maximum possible cash flow. (Clearly, we fish in every case.) This determines the cash flow received that season, and we assume that we obtain that cash at the beginning of the season. Hence we do not discount the profit. The value obtained is the (running) present value, as viewed from that time. These values are indicated on a copy of the-lattice in Figure 5.9.
Next we back up one time period and calculate the maximum present values at that time. For example, for the node just to the right of the initial node, we have
![]()
The maximum is attained by the second choice, corresponding to the downward branch, and hence V = 14+ .8 x 14 = 25.2. The discount rate of 1/1.25 = .8 is applicable at every stage since the spot rate curve is flat. Finally, a similar calculation is carried out for the initial node. The value there gives the maximum present value. The optimal path is the path determined by the optimal choices we discovered in the procedure. The optimal path for this example is indicated in Figure 5.9 by the heavy line. In words, the solution is not to fish the first season (to let the fish population increase) and then fish the next two seasons (to harvest the population).
Step by Step Answer: