The figure below shows a plot of the capacitor voltage from the circuit shown in Exercise P7.11.
Question:
The figure below shows a plot of the capacitor voltage from the circuit shown in Exercise P7.11. The capacitor voltage increases from 0 volts to B volts. The “rise time” is defined as the time required for the capacitor voltage to change from v1 = 0.05 × B to v2 = 0.95 × B. 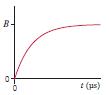
The file rc.txt contains a list of values of time t and the corresponding capacitor voltage v(t). A time in μs and the corresponding voltage in volts are printed on the same line. For example, the line 110 7.02261 indicates that the capacitor voltage is 7.02261 volts when the time is 110 μs. The time is increasing in the data file. Write a program that reads the file rc.txt and uses the data to calculate the rise time. Approximate B by the voltage in the last line of the file, and find the data points that are closest to 0.05 × B and 0.95 × B.
Data from Exercise P7.11.
After the switch in the figure below closes, the voltage (in volts) across the capacitor is represented by the equation
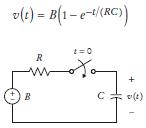
Suppose the parameters of the electric circuit are B = 12 volts, R = 500 Ω, and C = 0.25 μF. Consequently
v(t) = 12(1 − e−0.008t )
where t has units of μs. Read a file params.txt containing the values for B, R, C, and the starting and ending values for t. Write a file rc.txt of values for the time t and the corresponding capacitor voltage v(t), where t goes from the given starting value to the given ending value in 100 steps. In our example, if t goes from 0 to 1,000 μs, the twelfth entry in the output file would be: 110 7.02261
Step by Step Answer:
Heres a Python program to read the file rctxt and calculate the rise time import numpy as np Read t...View the full answer