

Fig. E8.8, below, is a chart with axes of (mathrm{m} / mathrm{m}_{o}) and (C / C_{o}) derived
Question:
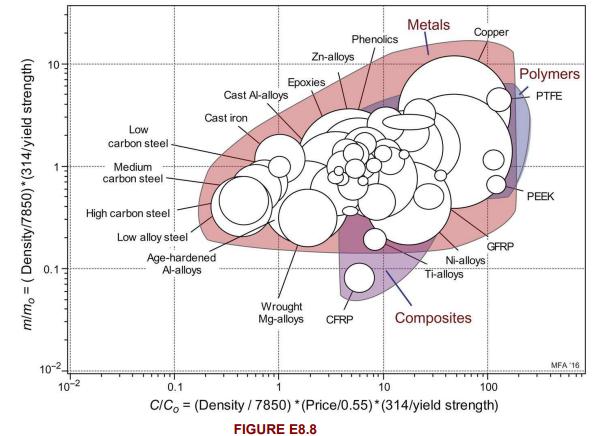
Fig. E8.8, below, is a chart with axes of \(\mathrm{m} / \mathrm{m}_{o}\) and \(C / C_{o}\) derived in Exercise E8.7 Mild steel (here labelled 'Low carbon steel') lies at the coordinates \((1,1)\). Sketch a trade-off surface - remember that it is simply a lower envelope to the data, with no mathematical function associated with it. Then plot contours of \(Z^{*}\) that are approximately tangent to the trade-off surface for \(\alpha^{*}=1\) and for \(\alpha^{*}=100\). They are plots of the linear relationship
\[\alpha^{*} \frac{m}{m_{o}}=-\frac{1}{\alpha^{*}} \frac{C}{C_{o}}\]
but appear as curves because of the log scales. What selections do these suggest?
Data From E8.8
Step by Step Answer:

This question has not been answered yet.
You can Ask your question!
Related Book For 
Question Posted:
