

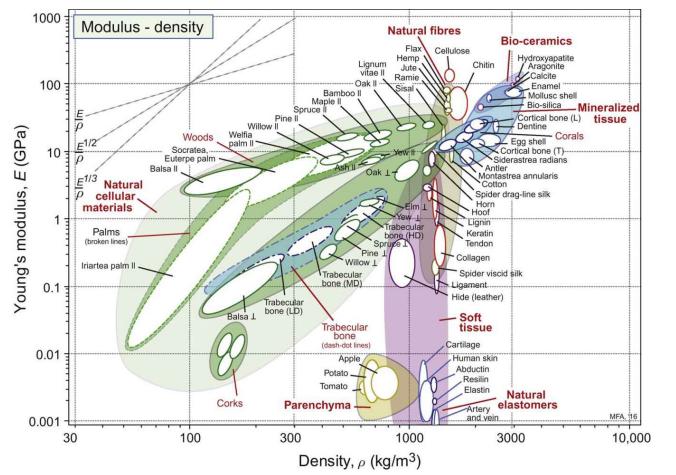
Plot aluminium alloys, steels, CFRP and GFRP onto a copy of the (E-ho) chart for natural materials
Question:
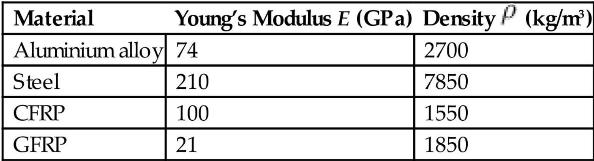
Plot aluminium alloys, steels, CFRP and GFRP onto a copy of the \(E-ho\) chart for natural materials (Figure 13.15 of Chapter 13, Hybrids: Case Studies), where \(E\) is Young's modulus and \(ho\) is the density. How do they compare, using the flexural stiffness index \(E^{1 / 2} / ho\) as criterion of excellence? The table lists the necessary data.
Data From Figure 13.15
Step by Step Answer:

This question has not been answered yet.
You can Ask your question!
Related Book For 
Question Posted:
