

Assume that the demand curve for Pepsi passes through the following two points: a. Draw a graph
Question:
Assume that the demand curve for Pepsi passes through the following two points:
a. Draw a graph with a linear demand curve that passes through these two points.
b. Show on the graph the areas representing total revenue at each price. Give the value for total revenue at each price.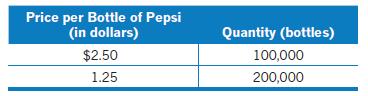
Fantastic news! We've Found the answer you've been seeking!
Step by Step Answer:
Heres a rough sketch of the graph with a linear demand curve passing through ...View the full answer

Answered By
Murshida P
Iam student, currently doing M.Tech in Transportation Engineering and Management from National Institute of Technology, Tiruchirapalli. During school the intrest in Mathematics, made me to choose engineering as the career option. I have a GATE score of 666. My great ambition is to become a professor. Iam also taking home tution for B.tech (Civil Engineering) students.
0 Reviews
10+ Question Solved
Related Book For 

Question Posted:
