

Consider an economy that produces and consumes hot dogs and hamburgers. In the following table are data
Question:
Consider an economy that produces and consumes hot dogs and hamburgers.
In the following table are data for two different years.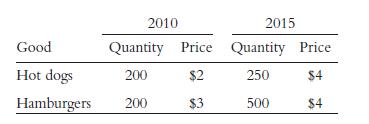
a. Using 2010 as the base year, compute the following statistics for each year: nominal GDP, real GDP, the implicit price deflator for GDP, and a fixed-weight price index such as the CPI.
b. By what percentage did prices rise between 2010 and 2015? Give the answer for each good and also for the two measures of the overall price level. Compare the answers given by the Laspeyres and Paasche price indexes.
Explain the difference.
Fantastic news! We've Found the answer you've been seeking!
Step by Step Answer:

Answered By
Diane Joyce Pastorin
Please accept my enthusiastic application to solutioninn. I would love the opportunity to be a hardworking, passionate member of your tutoring program. As soon as I read the description of the program, I knew I was a well-qualified candidate for the position.
I have extensive tutoring experience in a variety of fields. I have tutored in English as well as Calculus. I have helped students learn to analyze literature, write essays, understand historical events, and graph parabolas. Your program requires that tutors be able to assist students in multiple subjects, and my experience would allow me to do just that.
You also state in your job posting that you require tutors that can work with students of all ages. As a summer camp counselor, I have experience working with preschool and kindergarten-age students. I have also tutored middle school students in reading, as well as college and high school students. Through these tutoring and counseling positions, I have learned how to best teach each age group.
2+ Reviews
10+ Question Solved
Related Book For 

Question Posted:
