

Consider the data shown below for the Canadian Consumer Price Index (CPI), drawn from the Bank of
Question:
Consider the data shown below for the Canadian Consumer Price Index (CPI), drawn from the Bank of Canada's website.
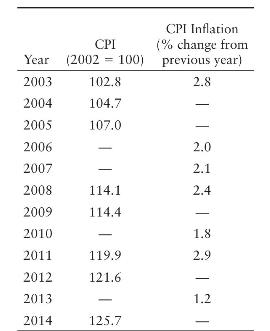
a. Compute the missing data in the table.
b. Do average prices ever fall in the time period shown? In which year do prices come closest to being stable?
c. Across which two consecutive years is the rate of inflation closest to being stable?
d. In a diagram with the price level on the vertical axis and time on the horizontal axis, illustrate the difference between a situation in which the price level is stable and a situation in which the rate of inflation is stable.
Fantastic news! We've Found the answer you've been seeking!
Step by Step Answer:

Answered By
DIPIN DAS AK
I completed my masters in chemistry from CUSAT, kerala, India. I studied bachelor of science from Calicut University and i had a project in nanotechnology from Hyderabad central university. I have two year teaching experience in higher secondary level in India as a private tutor. Now i work as a subject matter expert in conects app for part time. I love teaching and sharing knowledge.
0 Reviews
10+ Question Solved
Related Book For 
Question Posted:
