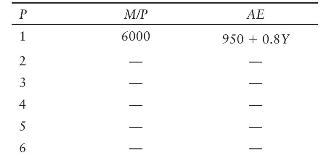
Consider the following simplified (A E) function: where (A E) is desired aggregate expenditure, (Y) is real
Question:
Consider the following simplified \(A E\) function:
![]()
where \(A E\) is desired aggregate expenditure, \(Y\) is real GDP, \(M\) is the private sector's nominal wealth, and \(P\) is the price level. Suppose that \(M\) is constant and equal to 600 0.
a. Fill in the table below:

b. Plot each of the \(A E\) functions-one for each price level-on the same-scale \(45^{\circ}\)-line diagram.
c. Compute the level of equilibrium national income \((Y)\) for each of the values of \(P\). For example, when \(P=1, A E=950+0.8 Y\). Thus the equilibrium level of \(Y\) is such that \(Y=950+0.8 Y\), which implies \(Y=4750\).
d. Plot the pairs of price level and equilibrium national income on a scale diagram with \(P\) on the vertical axis and \(Y\) on the horizontal axis. What is this curve you have just constructed?
e. Explain why the expression for \(A E\) above makes sense. Why do \(M\) and \(P\) enter the \(A E\) function?
Step by Step Answer:


