

Draw a graph similar to panel (a) of Figure 13.5, showing the effect of installing Just Walk
Question:
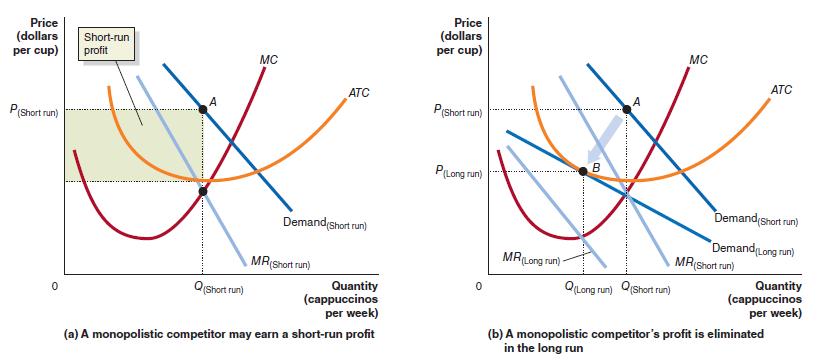
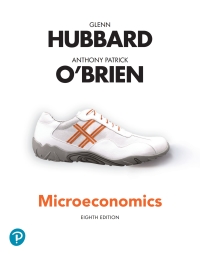
Draw a graph similar to panel (a) of Figure 13.5, showing the effect of installing Just Walk Out technology in a convenience store that had previously used a conventional checkout process with cash registers and cashiers. Assume that the technology causesa decline in both the fixed cost and the marginal cost of selling a quart of milk. Your graph should show the changes in the store’s cost curves, in its profit-maximizing price and quantity, and in the area representing the store’s profit. Assume for simplicity that quarts of milk are the only product the store sells.
Data given in Figure 13.5
Step by Step Answer:

This question has not been answered yet.
You can Ask your question!
Related Book For 
Question Posted:
