

Figure 13-10 shows the actual budget deficit and the cyclically adjusted budget deficit as a percentage of
Question:
Figure 13-10 shows the actual budget deficit and the cyclically adjusted budget deficit as a percentage of GDP in the United States from 1970 to 2014. Assuming that potential output was unchanged, use this figure to determine which of the years from 1990 to 2013 the government used expansionary fiscal policy and in which years it used contractionary fiscal policy.
Figure 13-10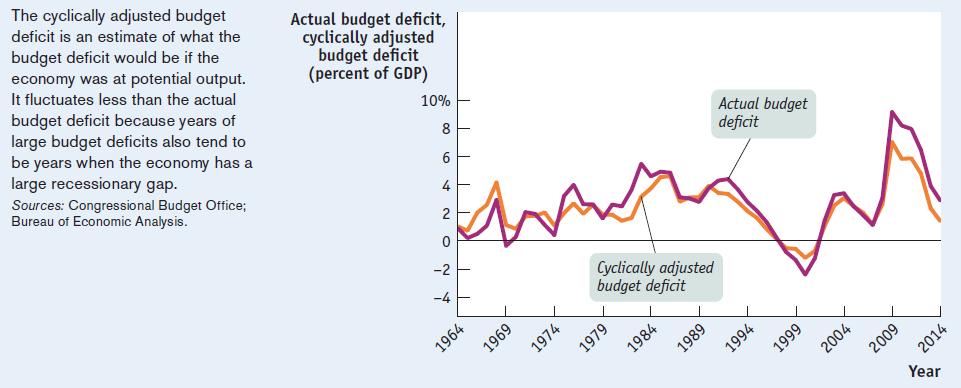
Fantastic news! We've Found the answer you've been seeking!
Step by Step Answer:

Answered By
Milan Mondal
I am milan mondal have done my Msc in physics (special astrophysics and relativity) from the University of burdwan and Bed in physical science from the same University.
From 2018 I am working as pgt physics teacher in kendriya vidyalaya no2 kharagpur ,west bengal. And also I am doing advanced physics expert in chegg.com .also I teach Bsc physics .
I love to teach physics and acience.
If you give me a chance I will give my best to you.
4+ Reviews
10+ Question Solved
Related Book For 

Question Posted:
