

The accompanying diagram shows the inflation rate in the United Kingdom from 1980 to 2019. a. Between
Question:
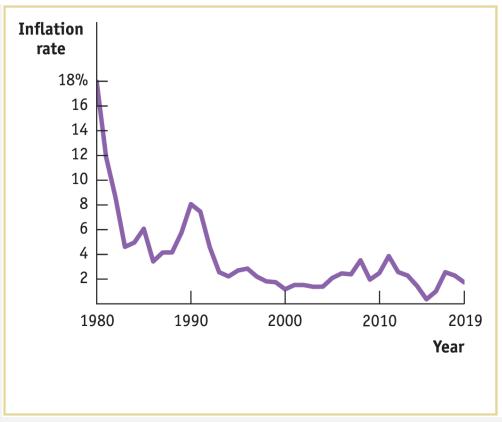
The accompanying diagram shows the inflation rate in the United Kingdom from 1980 to 2019.
a. Between 1980 and 1985, policy makers in the United Kingdom worked to lower the inflation rate. What would you predict happened to unemployment between 1980 and 1985?
b. Policy makers in the United Kingdom react forcefully when the inflation rate rises above a target rate of 2%. Why would it be harmful if inflation rose from 0.7% (the level in 2019) to, say, a level of 5%?
Fantastic news! We've Found the answer you've been seeking!
Step by Step Answer:

Answered By
Mugdha Sisodiya
My self Mugdha Sisodiya from Chhattisgarh India. I have completed my Bachelors degree in 2015 and My Master in Commerce degree in 2016. I am having expertise in Management, Cost and Finance Accounts. Further I have completed my Chartered Accountant and working as a Professional.
Since 2012 I am providing home tutions.
2+ Reviews
10+ Question Solved
Related Book For 
Question Posted:
