

The accompanying scatter diagram shows the relationship between the unemployment rate and the output gap in the
Question:
The accompanying scatter diagram shows the relationship between the unemployment rate and the output gap in the United States from 1996 to 2013. Draw a straight line through the scatter of dots in the figure.
Assume that this line represents Okun’s law:
Unemployment rate = b − (m × Output gap)
where b is the vertical intercept and −m is the slope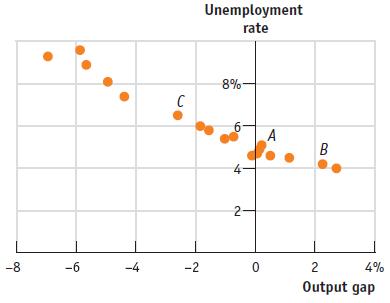
What is the unemployment rate when aggregate output equals potential output? What would the unemployment rate be if the output gap were 2%? What if the output gap were −3%? What do these results tell us about the coefficient m in Okun’s law?
Step by Step Answer:

This question has not been answered yet.
You can Ask your question!
Related Book For 

Question Posted:
