

The accompanying table shows data from the Penn World Table, Version 8.0, for real GDP per capita
Question:
The accompanying table shows data from the Penn World Table, Version 8.0, for real GDP per capita in 2005 U.S. dollars for Argentina, Ghana, South Korea, and the United States for 1960, 1970, 1980, 1990, 2000, and 2011.
a. Complete the table by expressing each year’s real GDP per capita as a percentage of its 1960 and 2011 levels.
b. How does the growth in living standards from 1960 to 2011 compare across these four nations? What might account for these differences?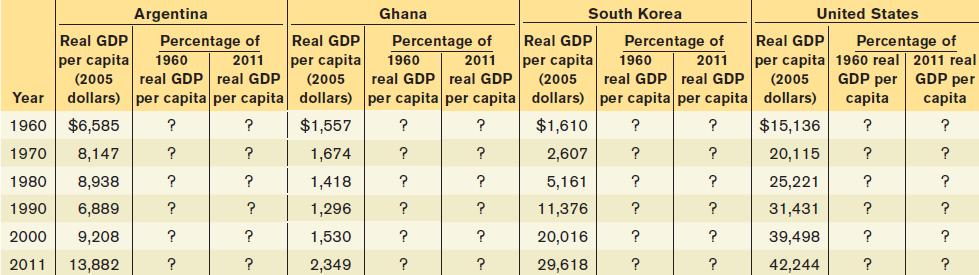
Fantastic news! We've Found the answer you've been seeking!
Step by Step Answer:

Answered By
PALASH JHANWAR
I am a Chartered Accountant with AIR 45 in CA - IPCC. I am a Merit Holder ( B.Com ). The following is my educational details.
PLEASE ACCESS MY RESUME FROM THE FOLLOWING LINK: https://drive.google.com/file/d/1hYR1uch-ff6MRC_cDB07K6VqY9kQ3SFL/view?usp=sharing
3+ Reviews
10+ Question Solved
Related Book For 

Question Posted:
