

The accompanying table shows the annual growth rate for the years 20002011 in per capita emissions of
Question:
The accompanying table shows the annual growth rate for the years 2000–2011 in per capita emissions of carbon dioxide (CO2) and the annual growth rate in real GDP per capita for selected countries.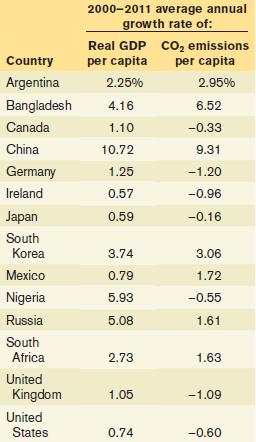
Fantastic news! We've Found the answer you've been seeking!
Step by Step Answer:

Answered By
Felix Mucee
I am a detailed and thorough professional writer with 5 years of administrative experience- the last 2 years in academic writing and virtual office environment. I specialize in delivering quality services with respect to strict deadlines and high expectations. I am equipped with a dedicated home office complete with a computer, copier/scanner/fax and color printer.
I provide creative and detailed administrative, web search, academic writing, data entry, Personal assistant, Content writing, Translation, Academic writing, editing and proofreading services. I excel at working under tight deadlines with strict expectations. I possess the self-discipline and time management skills necessary to have served as an academic writer for the past five years. I can bring value to your business and help solve your administrative assistant issues.
13+ Reviews
33+ Question Solved
Related Book For 

Question Posted:
