The diagram below shows the demand for money and the supply of money. a. Given the position
Question:
The diagram below shows the demand for money and the supply of money.
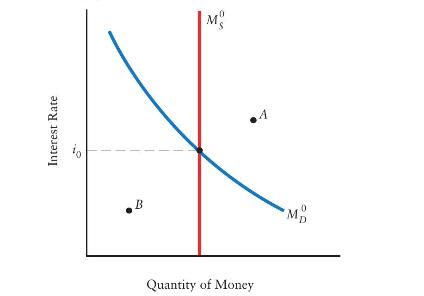
a. Given the position of the \(M_{D}\) curve, explain why it is not possible for the Bank of Canada to set the money supply and the interest rate at point \(A\) or at point \(B\).
b. In the diagram, draw a new money demand curve, \(M_{D}^{1}\), to the right of \(M_{D}^{0}\). Suppose the \(M_{D}\) curve is shifting in unpredictable ways between \(M_{D}^{0}\) and \(M_{D}^{1}\). Why is a monetary policy that sets the interest rate more stable (and therefore preferable) to one that sets the money supply?
c. The Bank of Canada implements its monetary policy by setting the target for the overnight interest rate. If the Bank reduces its target, explain what happens to the amount of money in the economy. What is the role of open-market operations in the Bank's policy?
Step by Step Answer:

This question has not been answered yet.
You can Ask your question!