

The diagram below shows the demand for money and the supply of money. a. Explain why the
Question:
The diagram below shows the demand for money and the supply of money.
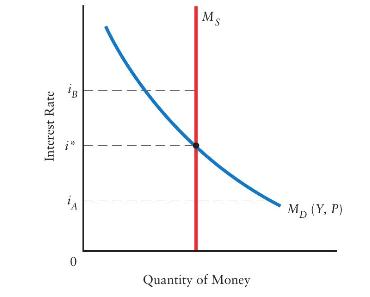
a. Explain why the \(M_{D}\) function is downward sloping.
b. Suppose the interest rate is at \(i_{A}\). Explain how firms and households attempt to satisfy their excess demand for money. What is the effect of their actions?
c. Suppose the interest rate is at \(i_{B}\). Explain how firms and households attempt to dispose of their excess supply of money. What is the effect of their actions?
d. Now suppose there is an increase in the transactions demand for money (perhaps because of growth in real GDP). Beginning at \(i^{*}\), explain what happens in the money market. How is this shown in the diagram?
Fantastic news! We've Found the answer you've been seeking!
Step by Step Answer:

Answered By
Aparna Babu
I completed my 10 the with 90% CBSE and 12th with 87% CBSE. I completed my bachelor's degree in electronics and communication engineering with 69.73% and Masters in communication engineering with 70.3%. Since teaching is my passion I started taking tutions at home during my college time but took it as a profession after my college. Then I joined TIME institute and served as maths teacher and also IIT foundation trainer.
0 Reviews
10+ Question Solved
Related Book For 

Question Posted:
