The diagram below shows two paths for aggregate consumption. One grows at a rate of 3 percent
Question:
The diagram below shows two paths for aggregate consumption. One grows at a rate of 3 percent per year; the other grows at 4 percent per year but begins at a lower level.
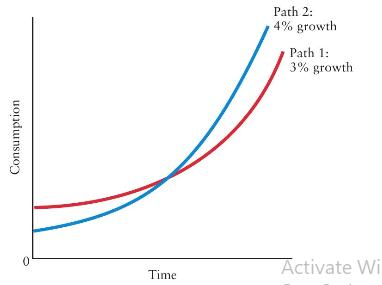
a. Suppose the economy jumps from Path 1 to Path 2 in Year 0 because its rate of capital accumulation increases. What is the opportunity cost in this economy for this increase in capital accumulation?
b. Suppose the economy jumps from Path 1 to Path 2 in Year 0 because its rate of R\&D (research and development) expenditures increases. The greater R\&D leads to technological improvements that generate the higher growth rate. What is the opportunity cost to this economy for the increase in \(\mathrm{R} \& \mathrm{D}\) expenditures?
c. Given the two paths in the diagram, can you offer a way to identify the "break-even" point for making the jump from Path 1 to Path 2 ? Explain.
Step by Step Answer: