

The figure below represents the production function relating output to capital in the United States. Suppose unusual
Question:
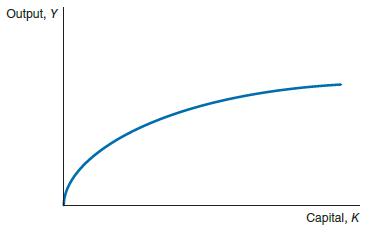
The figure below represents the production function relating output to capital in the United States. Suppose unusual weather conditions result in a higher than expected crop yield in the midwestern states.
a) Draw the new production function in the same graph.
b) What is the effect on the marginal product of capital?
Step by Step Answer:

This question has not been answered yet.
You can Ask your question!
Related Book For 

Question Posted:
