

The following diagram shows the (A D, A S), and (Y *) curves for an economy. Suppose
Question:
The following diagram shows the \(A D, A S\), and \(Y *\) curves for an economy. Suppose the economy begins at point \(A\). Then the government increases its level of purchases \((G)\).
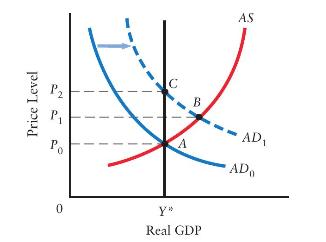
a. Describe the short-run effects of this fiscal expansion.
b. Describe the adjustment process, and the new longrun equilibrium for the economy.
c. Explain how the composition of real GDP has changed from the initial to the new long-run equilibrium.
d. Repeat parts (a), (b), and
(c) for a fiscal expansion generated by a reduction in the net tax rate.
Fantastic news! We've Found the answer you've been seeking!
Step by Step Answer:

Answered By
David Ngaruiya
i am a smart worker who concentrates on the content according to my clients' specifications and requirements.
7+ Reviews
19+ Question Solved
Related Book For 
Question Posted:
