

The following graph shows the effect of a tax imposed on soft drinks. Use this graph to
Question:
The following graph shows the effect of a tax imposed on soft drinks. Use this graph to answer the questions.
a. Which areas in the graph represent the excess burden (deadweight loss) of the tax?
b. Which areas represent the revenues collected by the government from the tax?
c. Would economists consider this tax to be efficient? Briefly explain.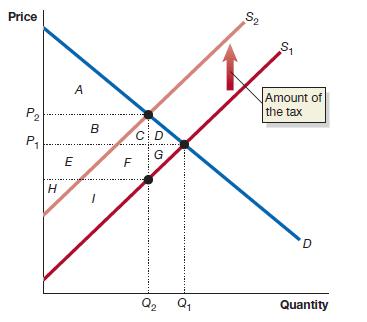
Fantastic news! We've Found the answer you've been seeking!
Step by Step Answer:
a The excess burden deadweight loss of the tax is represented by the area BCD in the graph This is t...View the full answer

Answered By
Sandhya Sharma
I hold M.Sc and M.Phil degrees in mathematics from CCS University, India and also have a MS degree in information management from Asian institute of technology, Bangkok, Thailand. I have worked at a international school in Bangkok as a IT teacher. Presently, I am working from home as a online Math/Statistics tutor. I have more than 10 years of online tutoring experience. My students have always excelled in their studies.
119+ Reviews
214+ Question Solved
Related Book For 
Question Posted:
