The following table shows hypothetical data from 201 0 to 201 6 that can be used to
Question:
The following table shows hypothetical data from 201 0 to 201 6 that can be used to compute the change in the debt-to-GDP ratio. The symbols used are as defined in the text.
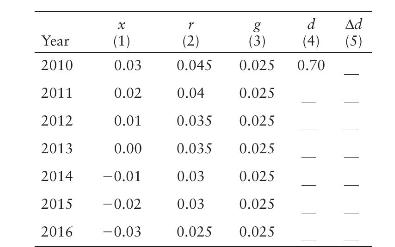
a. Remember from the text that the change in the debt-to-GDP ratio \((\Delta d)\) during a year is given by \(\Delta d=x+(r-g) d\). Compute \(\Delta d\) for 201 0.
b. Note that \(d\) at the beginning of 201 1 is equal to \(d\) at the beginning of 201 0 plus \(\Delta d\) during 201 0 . Compute \(d\) in 201 1.
c. Using the same method, compute \(d\) and \(\Delta d\) for each year, and complete columns 4 and 5 .
d. Plot \(d\) in a scale diagram with the year on the horizontal axis. What discretionary variable was most responsible for the observed decline in \(d\) ?
e. Note that as the primary deficit \((x)\) falls between 201 0 and 201 6, there is also a downward trend in the real interest rate. Can you offer an explanation for this?
Step by Step Answer:

This question has not been answered yet.
You can Ask your question!