

The following table shows the components of M1 and M2 in billions of dollars for the month
Question:
The following table shows the components of M1 and M2 in billions of dollars for the month of December in the years 2003 to 2013 reported by the Federal Reserve Bank of St. Louis. Complete the table by calculating M1, M2, currency in circulation as a percentage of M1, and currency in circulation as a percentage of M2.
What trends or patterns about M1, M2, currency in circulation as a percentage of M1, and currency in circulation as a percentage of M2 do you see? What might account for these trends?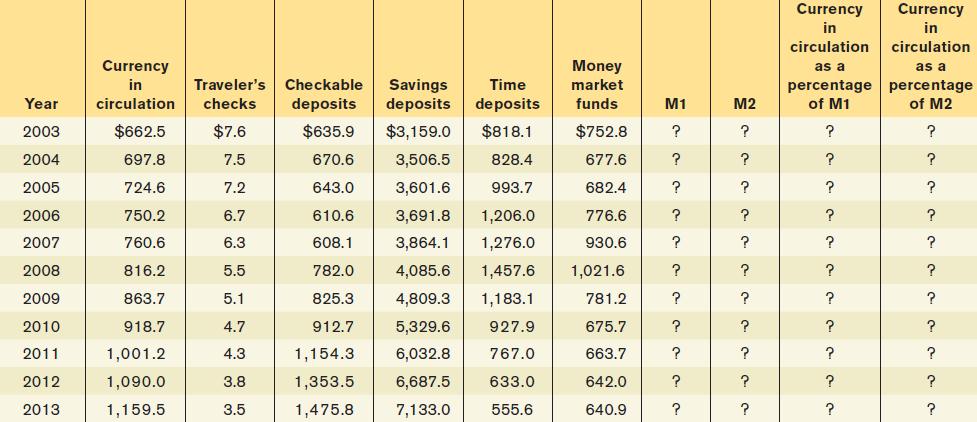
Fantastic news! We've Found the answer you've been seeking!
Step by Step Answer:

Answered By
Kennedy Odhiambo
As a professional writer, I have been in the field for over 5 years having worked as a lecture in different tertiary institutions across the world. With this impeccable experience, I assure provision of a good and supporting environment for students to learn.
2+ Reviews
10+ Question Solved
Related Book For 

Question Posted:
