

The following table shows the pattern of real GDP, potential GDP, and the unemployment rate for several
Question:
The following table shows the pattern of real GDP, potential GDP, and the unemployment rate for several years in Cycleland.
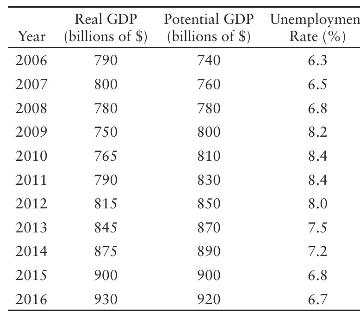
a. On a scale diagram, draw the path of real GDP and potential GDP (with time on the horizontal axis).
b. On a separate diagram (below the first one) show the path of the unemployment rate.
c. For which years is it possible to determine the value of the NAIRU?
d. Does the NAIRU change over the 10 -year period? Provide one reason that the NAIRU could increase.
Step by Step Answer:

This question has not been answered yet.
You can Ask your question!
Related Book For 
Question Posted:
