

The following table shows unemployment and inflation rates for Canada during the 19721982 period: a) Plot Canadas
Question:
The following table shows unemployment and inflation rates for Canada during the 1972–1982 period:
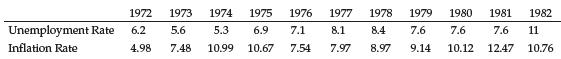
a) Plot Canada’s unemployment rates during this period. On the same graph, draw a horizontal line at 7.3%, representing Canada’s estimated natural rate of unemployment.
b) Considering the graph, how would you describe Canada’s inflationary policy during the 1972–1982 period?
Fantastic news! We've Found the answer you've been seeking!
Step by Step Answer:
ANSWER a Option A is correct As unemployment is lower than the natural r...View the full answer

Answered By
Sigei Kipngeno
I am a professional writer with more than 2 years of writing experience. I will always deliver a grade A paper with zero plagiarism . Thanks in advance.
175+ Reviews
311+ Question Solved
Related Book For 

Question Posted:
