

The graph shown below is based on quarterly data on unemployment and real output growth in the
Question:
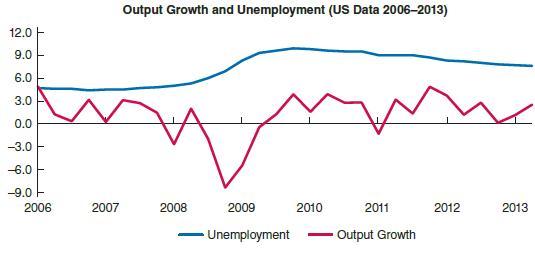
The graph shown below is based on quarterly data on unemployment and real output growth in the United States between 2006 (q1) and 2013 (q2). Are these data consistent with the real business cycle theory hypothesis regarding the relationship between output and unemployment?
Step by Step Answer:

This question has not been answered yet.
You can Ask your question!
Related Book For 

Question Posted:
