

The Heritage Index, published yearly by the Heritage Foundation, provides a comprehensive numerical measure of overall economic
Question:
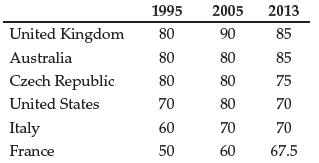
The Heritage Index, published yearly by the Heritage Foundation, provides a comprehensive numerical measure of overall economic freedom for countries, with specific indicators reflecting the overall quality of financial markets through two indicators: financial freedom and investment freedom(for more information, see heritage.org/index). The table in the next column reports the average of both scores for the years 1995, 2005, and 2013. Scores closer to 100 represent “free” countries; countries with scores below 50 are considered “repressed” with regard to that particular indicator. Use the investment and financial freedom data in the table, and go to the St. Louis Federal Reserve FRED database and find data on real GDP per capita for the United Kingdom (GBRRGDPC), Australia (AUSRGDPC), the Czech Republic (CZERGDPC), the United States (USARGDPC), France (FRARGDPC), and Italy (ITARGDPC). Download the data into a single spreadsheet.
Investment & Financial Freedom Average
a) For each country, calculate the average yearly growth rate from 1995 to 2005, and from 2005 to the most current period available. To do this, take the value at the beginning of the period, subtract it from the value at the end of the period, and divide by the beginning period value. Multiply by 100 to change the result to a percent, and then divide by the number of years in the period. Report the growth rates for each country across each period.
b) Calculate the average of the per capita real GDP growth rates for the 1995 to 2005 and 2005 to current periods for the top three countries listed in 2013, and also for the bottom three countries listed. Do you see any relationship between financial market freedom and economic growth? Briefly explain.
c) The United States, Italy, France, and the United Kingdom all increased their scores by 10 between 1995 and 2005, while the scores of Australia and the Czech Republic remained constant during this period. Comment on the effect of increases in a country’s score over time versus the overall level of the score as it relates to economic growth.
Step by Step Answer:
Answer a Average Yearly Growth Rate Well use the formula AverageYearlyGrowthRate EndValue StartValue StartValue 100 1 NumberofYears AverageYearlyGrowt...View the full answer


