

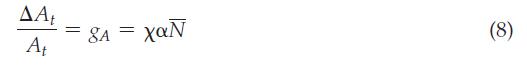
The production function for technology in Equation 8 can be expressed as Assume that = 1,
Question:
The production function for technology in Equation 8 can be expressed as
![]()
Assume that χ = 1, that both N̅ and α can vary over time, and that N̅ is interpreted as the labor force rather than population. Go to the St. Louis Federal Reserve FRED database, and find data on real GDP (GDPCA), the labor force (CLF16OV), and a measure of the capital stock, real consumption of fixed capital (A262RX1A020NBEA). Download all of the data onto a spreadsheet; for (CLF16OV), change the frequency setting to “annual” before downloading. In the spreadsheet, convert the labor force series so that it is “indexed” to 1 in 1980. To do this, for each year of (CLF16OV), divide the labor force number by the labor force number in 1980.
Then convert the data into real GDP per worker and capital per worker by dividing (GDPCA) and (A262RX1A020NBEA) by the indexed labor force data for each year. Note that this conversion will be represented as $ millions of output and capital per worker.
a) Use the “production function for technology” expression given above to solve for αt, the proportion of labor devoted to R&D, as a function of all other variables.
b) For each year from 1980 up to the most current year available, calculate k0.3. Use this value, along with the transformed real GDP per worker series, to calculate a measure of total factor productivity.
c) Use your answers to parts (a) and (b) to construct a measure of α (the proportion of the labor force dedicated to R&D) for each year from 1980 to the most current data available. (Note: this will be one year less than your data availability spans, since you will need to use one year ahead TFP to determine the current year’s α. Do not worry if some values of α are negative.)
d) Calculate the average value of for the period from 1980 to 1999, and for the period from 2000 to the most current period available. Comment on the averages over the two periods. Based on the endogenous growth model, what do you expect, for the two periods, for growth rates in terms of real GDP per person?
e) Now, calculate the average yearly growth rate of real GDP per capita from 1980 to 1999, and from 2000 to the most current period available. To do this, take the value of real GDP per capita at the end of the time period, subtract it from the value at the beginning of the time period, and divide by the value at the beginning of the time period. Then divide by the number of years in the period. Report the average constructed values for α and gy over the two periods, and comment on the results as they relate to your expectations in part (d).
Equation 8
Step by Step Answer:


