The rate of inflation and expected inflation in different decades Fill in the values in the table
Question:
The rate of inflation and expected inflation in different decades Fill in the values in the table below for inflation and expected inflation of your country during the 1980s. You need to use a spreadsheet once again.
From the 1980's
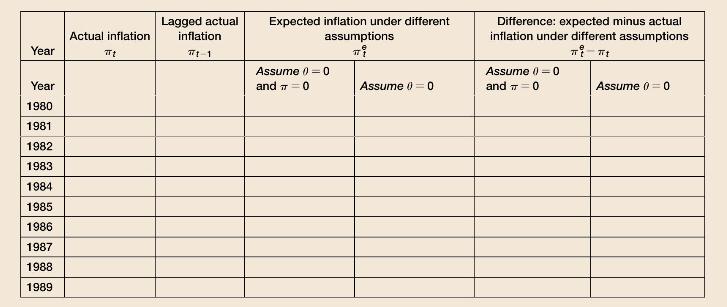
a. The textbook shows that the 1970s showed an inverse relationship between inflation and unemployment. Has this relationship between inflation and unemployment prevailed in the 1980s?
b. What is the best value for each of \(\theta\) and \(\pi\) in the 1980s? Explain your answer.
Fill in the values in the table below for inflation and expected inflation using the 1990s.
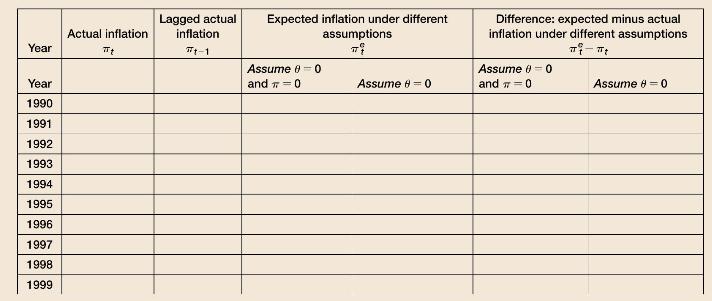
c. Has the inverse relationship between inflation and unemployment relationship between inflation and unemployment prevailed in the 1990s??
d. What is the best value for each of \(\theta\) and \(\pi\) in the 1990s? Explain your answer.
e. How do you compare the behavior of inflation, its average level and its persistence across the 1980s and 1990s?
Step by Step Answer: