The table below shows the percentage of the labour force accounted for by youths (15 to 24
Question:
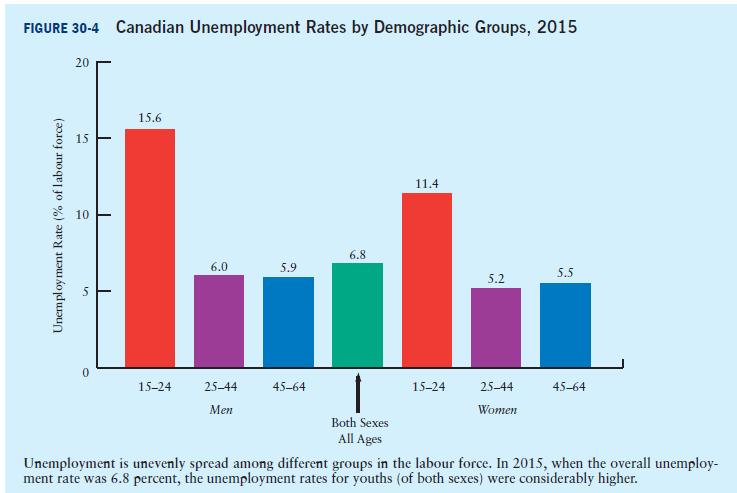
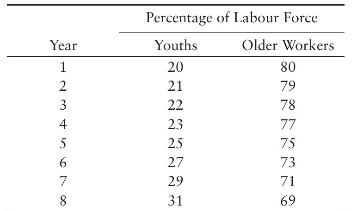
The table below shows the percentage of the labour force accounted for by youths (15 to 24 years old) and older workers (25 years and older) over several years. Suppose that because of their lower skills and greater turnover, youths have a higher unemployment rate than older workers (see Figure 30 -4).
a. Suppose that in Year 1 real GDP is equal to potential GDP, and the unemployment rate among older workers is 6 percent but is 14 percent among youths. What is the economy's NAIRU?
b. Now suppose that for the next eight years real GDP remains equal to potential and that the unemployment rates for each group remain the same. Compute the value of the NAIRU for each year.
c. Explain why the NAIRU rises even though output is always equal to potential.
Step by Step Answer: