

Use the following Lorenz curve graph to answer the questions. a. Did the distribution of income become
Question:
Use the following Lorenz curve graph to answer the questions.
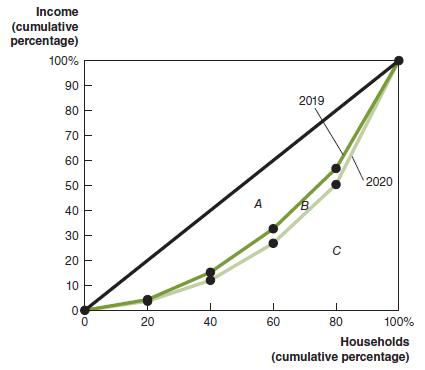 a. Did the distribution of income become more equal in 2020 than it was in 2019, or did it become less equal? Briefly explain.
b. If area A = 2,150, area B = 250, and area C = 2,600, calculate the Gini coefficient for 2019 and the Gini coefficient for 2020.
Fantastic news! We've Found the answer you've been seeking!
Step by Step Answer:
a Distribution of income in 2020 vs 2019 The Lorenz curve for 2020 is below the Lorenz curve for 201...View the full answer

Answered By
Krishna Kumar
I am studying in ug , chemistry .
I have teaching experience .
But I will. give my best
0 Reviews
10+ Question Solved
Related Book For 

Question Posted:
