

As shown in Figure 7.8, the college wage premium declined in the 1970s. Using a supply-and-demand graph,
Question:
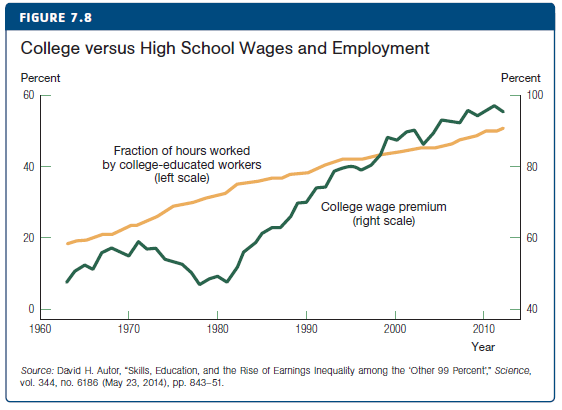
As shown in Figure 7.8, the college wage premium declined in the 1970s. Using a supply-and-demand graph, explain why this decline might have occurred.
Fantastic news! We've Found the answer you've been seeking!
Step by Step Answer:
The decrease in the college wage premium in the 1970 s can be explained ...View the full answer

Answered By
DHRUV RAI
As a tutor, I have a strong hands-on experience in providing individualized instruction and support to students of all ages and ability levels. I have worked with students in both one-on-one and group settings, and I am skilled in creating engaging and effective lesson plans that meet the unique needs of each student.
I am proficient in using a variety of teaching techniques and approaches, including problem-based learning, inquiry-based learning, and project-based learning. I also have experience in using technology, such as online learning platforms and educational software, to enhance the learning experience for my students.
In addition to my teaching experience, I have also completed advanced coursework in the subjects that I tutor, including mathematics, science, and language arts. This has allowed me to stay up-to-date on the latest educational trends and best practices, and to provide my students with the most current and effective teaching methods.
Overall, my hands-on experience and proficiency as a tutor have equipped me with the knowledge, skills, and expertise to help students achieve their academic goals and succeed in their studies.
0 Reviews
10+ Question Solved
Related Book For 

Question Posted:
