

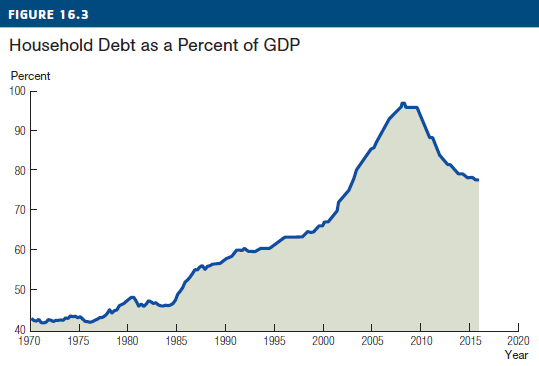
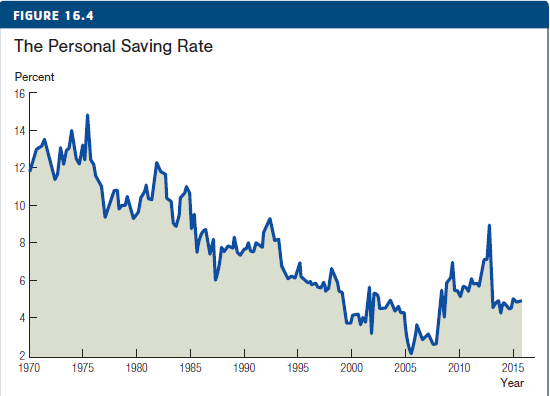
Figures 16.3 and 16.4 show household debt as a percentage of GDP and the personal saving rate.
Question:
(a) Using the FRED database hosted by the Federal Reserve Bank of St. Louis, obtain the latest values for these two statistics. How has the ratio of household debt to GDP changed since 2007? What about the personal saving rate?
(b) Discuss some possible explanations for these changes.
Fantastic news! We've Found the answer you've been seeking!
Step by Step Answer:
a Recent data provided by FRED is as follows b These results are more or less anti...View the full answer

Answered By
Surojit Das
I have vast knowledge in the field of Mathematics, Business Management and Marketing. Besides, I have been teaching on the topics Management leadership, Business Administration, Human Resource Management, Business Communication, Accounting, Auditing, Organizer Behaviours, Business Writing, Essay Writing, Copy Writing, Blog Writing since 2020. It is my personality to act quickly in any emergency situations when students need my services. I am very professional and serious in every questions students asked me at the time of dealing any projects. I have been serving detailed, quality, properly analysed research paper through the years.
91+ Reviews
278+ Question Solved
Related Book For 

Question Posted:
