

Redraw the graph shown here and label each of the following: a. The equilibrium point b. The
Question:
Redraw the graph shown here and label each of the following: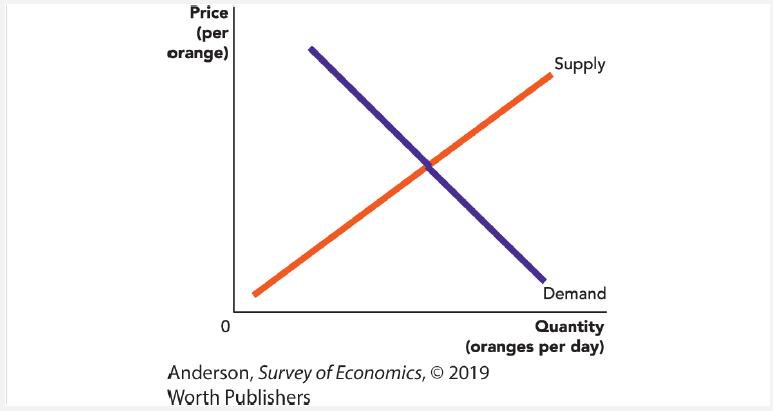
a. The equilibrium point
b. The equilibrium price and quantity
c. The level of a price floor that would alter the price charged in the market.
d. The horizontal distance that represents the surplus of oranges at the price floor you drew for part c.
Fantastic news! We've Found the answer you've been seeking!
Step by Step Answer:
Here is a redrawn economic graph with a supply and ...View the full answer

Answered By
Subash Murugaih
I am leading expert in this web site couple of years and My clients are much happy with my works and services.
309+ Reviews
539+ Question Solved
Related Book For 
Question Posted:
