

The following data give real GDP, Y, capital, (K), and labor, (N), for the U.S. economy in
Question:
The following data give real GDP, Y, capital, \(K\), and labor, \(N\), for the U.S. economy in various years.
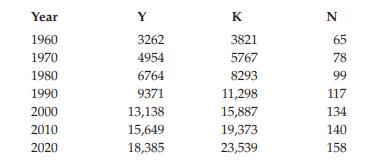
Units and sources are the same as in Table 3.1. Assume that the production function is \(Y=A K^{0.3} N^{0.7}\).
a. By what percentage did U.S. total factor productivity grow in each decade?
b. What happened to the marginal product of labor between 1960 and 2020? Calculate the marginal product numerically as the extra output gained by adding 1 million workers in each of the two years. The data for employment, \(N\), are measured in millions of workers, so an increase of 1 million workers is an increase of 1.0.
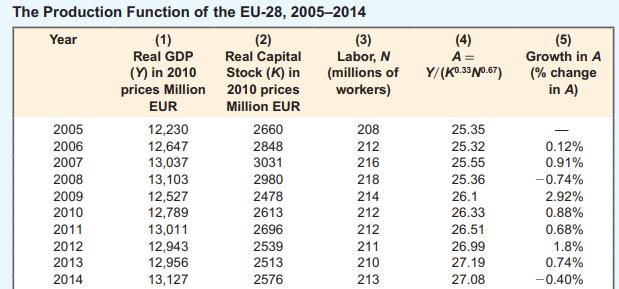
Table 3.1
Fantastic news! We've Found the answer you've been seeking!
Step by Step Answer:

Answered By
Nyron Beeput
I am an active educator and professional tutor with substantial experience in Biology and General Science. The past two years I have been tutoring online intensively with high school and college students. I have been teaching for four years and this experience has helped me to hone skills such as patience, dedication and flexibility. I work at the pace of my students and ensure that they understand.
My method of using real life examples that my students can relate to has helped them grasp concepts more readily. I also help students learn how to apply their knowledge and they appreciate that very much.
1+ Reviews
10+ Question Solved
Related Book For 
Question Posted:
