

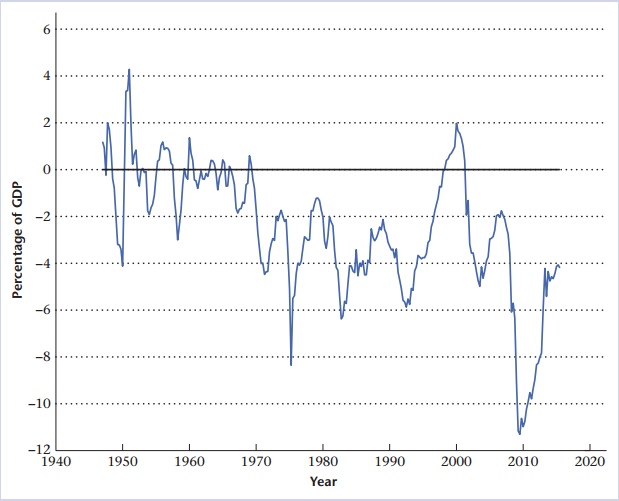
Use Figures 1.8 and 1.9 to determine why the total government deficit was large during the 20082009
Question:
Figure 1.8:
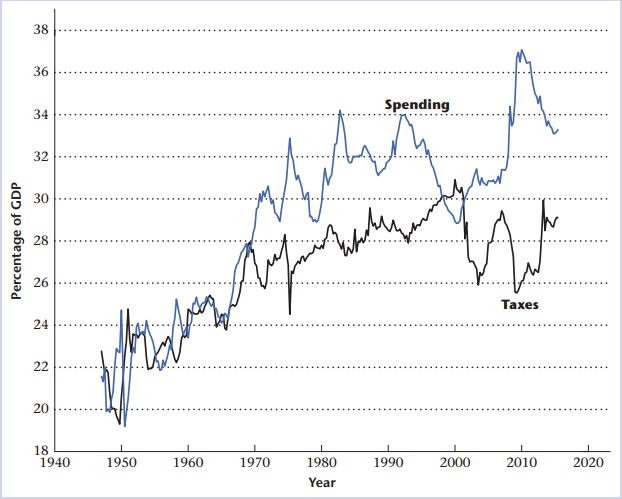
Figure 1.9:
Fantastic news! We've Found the answer you've been seeking!
Step by Step Answer:
Both During the recession taxes fell and spending rose Some of this occurred ...View the full answer

Answered By
Geoffrey Isaboke
I am an industrious tutor with a 5-yr experience in professional academic writing. I have passion for History and Music and I have good knowledge in Economics
2+ Reviews
10+ Question Solved
Related Book For 

Question Posted:
