

The table below shows data for real and nominal GDP for a hypothetical economy over several years.
Question:
The table below shows data for real and nominal GDP for a hypothetical economy over several years.
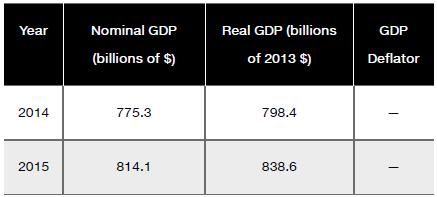
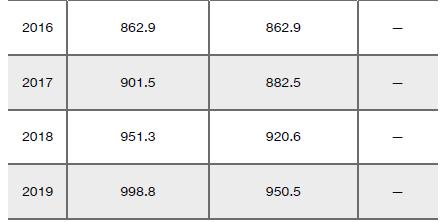
a. Compute the GDP deflator for each year.
b. Compute the total percentage change in nominal GDP from 2014 to 2019. How much of this change was due to increases in prices and how much was due to changes in quantities?
Fantastic news! We've Found the answer you've been seeking!
Step by Step Answer:

Answered By
PALASH JHANWAR
I am a Chartered Accountant with AIR 45 in CA - IPCC. I am a Merit Holder ( B.Com ). The following is my educational details.
PLEASE ACCESS MY RESUME FROM THE FOLLOWING LINK: https://drive.google.com/file/d/1hYR1uch-ff6MRC_cDB07K6VqY9kQ3SFL/view?usp=sharing
3+ Reviews
10+ Question Solved
Related Book For 

Question Posted:
