

Using data on the consumer price index (CPI) for all urban consumers, calculate and graph the annual
Question:
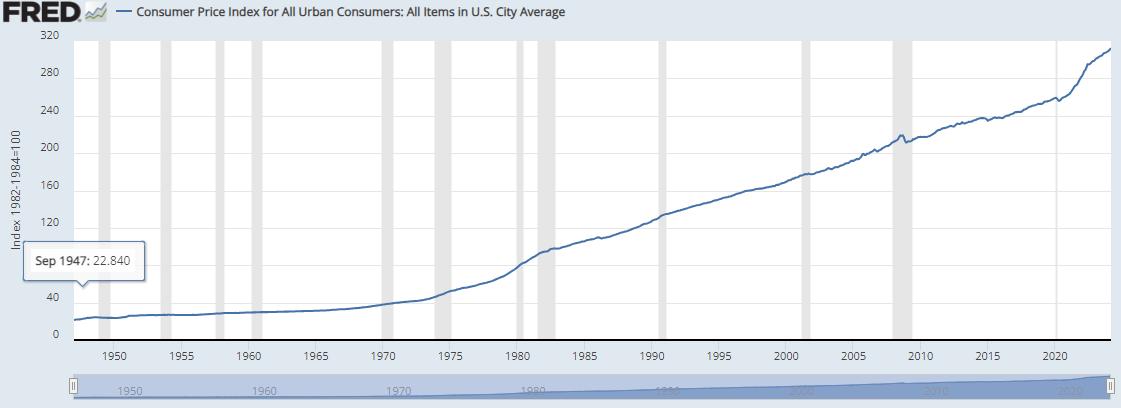
Using data on the consumer price index (CPI) for all urban consumers, calculate and graph the annual U.S. inflation rate (the percentage change in the price index from one year ago) for each year since 1948. In which periods within the postwar era did the United States experience the most severe inflation problems? In which periods has inflation been the most stable (that is, roughly constant from one year to the next)?
Consumer Price Index for All Urban Consumers:
Step by Step Answer:

This question has not been answered yet.
You can Ask your question!
Related Book For 

Macroeconomics
ISBN: 9780134167398
9th Edition
Authors: Andrew B. Abel, Ben Bernanke, Dean Croushore
Question Posted:
